7 Steps To Interpreting An Electrocardiogram
An electrocardiogram alone is nothing more than a meaningless graph. To interpret it, it is necessary to assess various aspects and contrast them with the available clinical data.
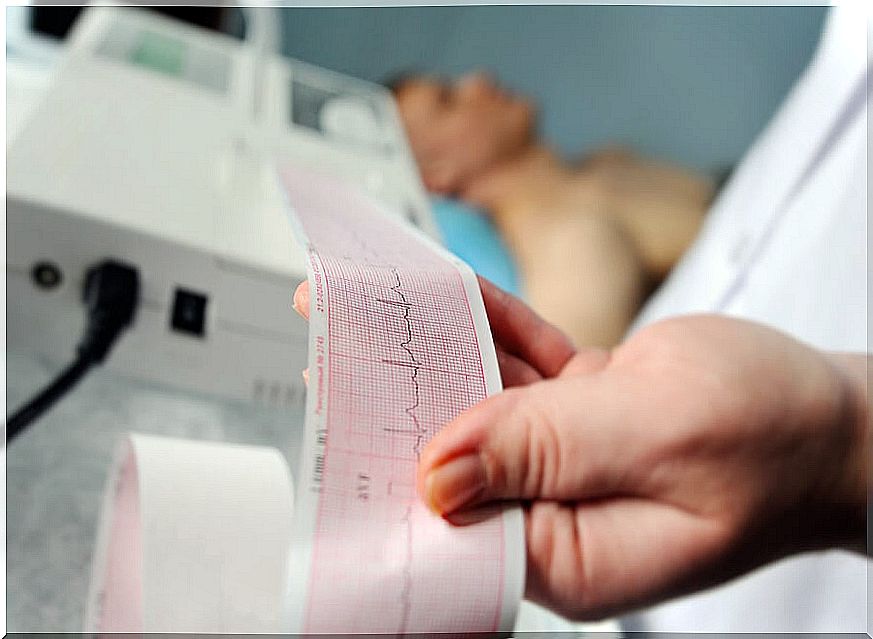
The electrocardiogram is one of the most widely used studies, especially in emergency departments and internal medicine. Interpreting it correctly is decisive in many circumstances. Although it is a common test, its interpretation is not as simple as it may seem at first glance.
Thus, the electrocardiogram records the electrical signals of the myocardial cells. Each heartbeat emits an electrical signal that is recorded by the EKG machine. In fact, the test allows you to visualize the activity of the heart and detect possible alterations.
In isolation, the EKG is nothing more than a linear figure. It simply returns a plot that the professional in charge must interpret. To do this, a series of steps are followed, such as those that we expose below.
Aspects to interpret an electrocardiogram

1. Verify the suitability of the electrocardiogram
The first thing to do is verify that the EKG was performed correctly. The electrocardiograph should have a velocity of 25 mm / s and an amplitude of 1 mV by 10 mm. If there is suspicion of error, the test must be repeated.
In case everything is in order, the data and values to be interpreted in this heart analysis are as follows:
2. Calculation of the patient’s heart rate
Heart rate is the first relevant piece of information to be extracted from an electrocardiogram . There are electrocardiographs that calculate it automatically. If not, there are manual methods that allow you to do this. Among them, the 300 method, the 1500 method and the 6 second method.
Heart rate is the number of times the heart contracts to pump blood to the rest of the body. This makes it possible to establish whether there is tachycardia or brachycardia, aspects that are essential to identify possible anomalies or problems.
3. Heart rhythm evaluation

The heart rhythm is the sequence of systoles and diastoles in the muscles of the heart . If this organ is normal, it has contractions between 70 and 75 times per minute. In an electrocardiogram it is represented in the QRS complexes.
This is one of the easiest data to observe. It allows you to determine if the heart rate is regular or irregular. Also if it is a normal sinus type or shows a sinus tachycardia or brachycardia.
4. Establishment of the cardiac electrical axis
This is one of the most difficult steps in interpreting an EKG. The cardiac electrical axis corresponds to the direction that the electrical stimulus follows , as it passes through the ventricles. The data provides information on possible intraventicular conduction defects.
5. ST segment evaluation
The QRS complex is the sum of the electrical discharges of all the cells of the ventricles. On the other hand is the T wave, which represents the repolarization or electrical recovery of the ventricles. The distance between the QRS complex and the T wave is called the ST segment.
Sometimes the ST segment presents elevation or descent, but if the values of these are not significant, the situation can be considered normal. On the other hand, if the values exceed the minimum range, it is very likely that there is ischemic heart disease.
6. Evaluation of waves and intervals

It is important to perform an analysis of each of the waves and intervals that have not been evaluated. Of particular importance is the PR interval and the QT interval. When the PR interval is short, it means that there is accelerated atrio-ventricular conduction. When it is long, it means that said driving is slowed down.
The QT interval represents the duration of ventricular electrical systole. It includes the QRS interval, the ST segment and the T wave, as shown by the Spanish Society of Cardiac Imaging in this graph. It is closely related to heart rate. When it is fast, the interval decreases and vice versa.
7. Schematic synthesis
In summary, the steps to follow to interpret an electrocardiogram in a schematic way are these:
- Determine heart rate.
- Set heart rate.
- Definition of the axis.
- Identify sinus rhythm (presence of Q waves before each QRS complex).
- Examine the PR interval.
- Assess the QT interval.
- Evaluate QSR complexes.
- Analyze the ST segment.
- Evaluate the T waves.
Once all these steps have been carried out, the next step is to name the anomaly (s) detected. From this it is possible to establish what are the actions to follow. Of course, it is the doctor who must interpret an electrocardiogram in order to make the appropriate decisions for each patient.